

Clinical cohorts
Ethics statement
The UCLH bronchoscopy study and the SUMMIT, ALPINE and Molecular Pathogenesis of Lung Disease II studies were approved by the UK Health Research Authority (HRA). The ASCENT study was approved by the HRA and Health and Care Research Wales. All human participants provided written informed consent before enrolment. Animal studies were approved by the University College London Biological Services Review Committee and were performed in accordance with the UK Animals (Scientific Procedures) Act 1986 and associated Home Office guidelines.
UCLH bronchoscopy surveillance study cohort
The UCLH bronchoscopy surveillance study16,18 (REC: 01/0148) is a longitudinal study of patients with preinvasive lesions of the bronchus. It aims to determine the nature of bronchial lesions and analyse the molecular, histological and immunocytochemical changes associated with their progression to invasion. Patients included must be able to provide informed written consent to participate, have preinvasive lesions of the bronchus and be 18 years of age or older. Patients were excluded from the study if they were unable or unwilling to provide informed consent, had a diagnosis of invasive carcinoma of the lung at the time of recruitment, specific respiratory diseases or other medical conditions affecting tolerance towards bronchoscopy, or suffered from coagulation abnormalities.
This surveillance study targeted individuals at high risk of lung cancer (that is, heavy smokers) and uses AFB to screen for preinvasive lesions in the bronchus. Preinvasive lesions in the central airway are classified into a spectrum of severity on the basis of their histology. Low-grade lesions include hyperplasia, metaplasia, mild dysplasia and moderate dysplasia. HGLs include severe dysplasia, CIS and microinvasive CIS (CIS+). Patients with low-grade lesions were monitored by AFB approximately once a year, and patients with HGLs were monitored every 3–6 months. For annotation of lesion grade for peripheral blood samples, the highest-grade lesion identified at the corresponding bronchoscopy visit was assigned. For these analyses, patients with inconsistent lesion grade over time were excluded from the cross-sectional analysis.
SUMMIT and ASCENT cohorts
The ASCENT study (REC: 20/SC/0128, NCT04204499)32 is a prospective, observational cohort study of participants scheduled to undergo surgical resection for low-dose CT (LDCT) screen-detected lung cancer. Participants will have undergone LDCT screening in the SUMMIT study (REC: 17/LO/2004, NCT03934866)34. SUMMIT is a prospective, observational cohort study that aims to assess the implementation of LDCT screening for lung cancer in a diverse, high-risk population in London and to validate a multicancer early detection blood test. Individuals aged 55–77 years who had been recorded as current smokers and were not on the palliative care register on their National Health Service (NHS) England primary care records any time in the previous 20 years were identified for invitation to a lung health check. Individuals who met the 2013 USPSTF criteria or had a prostate, lung, colorectal and ovarian 2012 model (PLCOM2012) 6-year risk of ≥1.3% and were not currently receiving treatments for an active cancer (except adjuvant hormonal therapy) were asked to provide informed consent to participate in the study. Blood samples were collected at surveillance time points before cancer diagnosis (SUMMIT), and blood, tumour and matched adjacent histologically normal tissue samples were collected at the point of surgical resection (ASCENT). Patients were excluded from the ASCENT study if they had active HIV, hepatitis B virus, hepatitis C virus or syphilis infection, or if the local multidisciplinary team decided to treat with neoadjuvant therapy for the current lung malignancy.
NSCLC samples in this study include both LUAD and LUSC samples in stages I–III, with 90% of samples analysed classified as stage I. At resection, some suspected NSCLC cases were found to be non-cancerous and were therefore excluded from analyses. These samples were classed as inflammation or benign tumours, and include granulomas, benign tumours, chronic inflammation, smoking-related changes, scarring, necrotizing granulomatous inflammation, non-necrotizing granulomatous inflammation, fungal balls, dendriform pulmonary ossification or lymph node changes.
Healthy age-matched control blood samples were collected from patients at the UCLH orthopaedic pre-assessment clinic before hip replacement surgery. Patients included were aged 50 years or over and were able to provide written informed consent. Patients with active infections, a history of malignancy, autoimmune conditions or abnormal full blood counts were excluded. For flow cytometry experiments, we also included samples from healthy donors obtained from leukocyte cones from NHS Blood and Transplant residual platelet donation.
ALPINE cohort
Biomarkers in lung health checks (ALPINE)33: assessment of novel biomarkers in participants undergoing targeted lung health checks (REC: 23/EM/0114, NCT05902559) is a prospective, observational cohort study of minimally invasive samples from patients undergoing screening in the North Central London Targeted Lung Health Check programme. The Targeted Lung Health Check programme is an NHS programme with the aim of using LDCT screening in individuals at high risk of lung cancer to improve early diagnosis and survival. It is also the continuation of SUMMIT, which enables blood and PBMC collection for immune analysis and contributes to recruitment for the ASCENT study once participants develop NSCLC and undergo surgical resection. Participants must be aged 55–74 years and be current or former smokers. In this study, whole blood and PBMC samples from the ALPINE study were used as ‘no cancer’ controls, selecting samples from participants undergoing LDCT screening but without any nodules presenting on imaging at the time of sampling.
Molecular Pathogenesis of Lung Disease II cohort
An investigation into the Molecular Pathogenesis of Lung Disease II (REC: 06/Q0505/12, IRAS: 245471)57 is a prospective, observational cohort established to investigate molecular changes in the human airway epithelium associated with the development and progression of lung disease. Participants are recruited from individuals undergoing a range of respiratory diagnostic and clinical procedures, including bronchoscopy, upper airway endoscopy, thoracic surgery (including video-assisted thoracoscopic surgery and surgical resection), radiology-guided biopsy, respiratory outpatient clinics or in-patient admissions. Eligible participants are adults (≥18 years) undergoing investigation for respiratory symptoms or follow-up of respiratory disease. For this study, only tumour and matched adjacent parenchyma from participants with a confirmed diagnosis of lung cancer were included.
For ASCENT and Molecular Pathogenesis of Lung Disease II cohorts, lung tissue was pathologically defined using UICC TNM, eighth edition, classification for malignant tumours by pathologists.
Human sample collection and profiling
Tissue sample processing for single-cell sequencing
Tissue biopsy samples of lesions collected during AFB (Supplementary Table 1) were finely cut using sterile scalpel blades and digested in a dissociation buffer containing 100 µg ml–1 DNase I (Sigma, DN25) and 1 mg ml–1 collagenase (Sigma, C9407) in HBSS (Gibco, 14025092) at 37 °C for 1 h with continuous agitation. Biopsy suspensions were filtered through a 70 µm cell strainer and washed once in PBS with 10% BSA, followed by incubation in 1× red blood cell (RBC) lysis buffer (Miltenyi Biotec, 130-094-183) for 2 min at room temperature (RT). Single-cell suspensions were then prepared for 10x sequencing by washing twice in PBS with 0.04% BSA. The cell concentration was adjusted to 1,000 cells per µl and samples were processed either with a Chromium Next GEM Single Cell 5′ Kit v.2 (10x Genomics, 1000265), with or without TCR amplification, according to manufacturer’s instructions. Libraries were sent to Novogene for sequencing.
For two bronchial biopsy samples with technical replicate preparations, P166 normal and P168 LT CIS, replicate libraries were pooled before downstream analyses and treated as a single biological sample for all sample-level analyses.
Blood sample processing
Blood samples were collected in Vacutainer EDTA blood collection tubes (BD Biosciences, 366643). PBMCs were isolated from whole blood by density gradient centrifugation (750g, 10 min, RT, no brake) using Ficoll Paque Plus (Cytiva, 17144003). The lymphocyte interface was washed twice with complete RPMI 1640 (Merck, R0883), resuspended in a solution containing FBS (PAN Biotech, P40-37500) supplemented with 10% DMSO (Merck, D2650-100ML) and cryopreserved in liquid nitrogen before downstream use. When buffy coats were also collected, Vacutainer EDTA tubes were centrifuged (1,800g, 15 min, RT, no brake) and the buffy coat interface was frozen directly in cryovials at −80 °C and preserved until downstream use.
PBMC sample preparation for single-cell sequencing
Cryopreserved PBMC samples were thawed using warm R20 medium (RPMI 1640 with 20% FBS, 2 mM l-glutamine (Merck, G7513-100ML), 10 mM HEPES (ThermoFisher Scientific, 15630056) and 100 U ml–1 penicillin–streptomycin (Merck, P0781-100ML)) and washed with R10 medium (RPMI 1640 with 10% FBS and 100 U ml–1 penicillin–streptomycin) containing 37.5 µg ml–1 DNase I. Cells were washed twice in FACS buffer.
For paired PBMC samples from the UCLH bronchoscopy surveillance cohort, a non-naive T cell sort was performed. Cells were stained with CCR7 and an Fc receptor binding inhibitor polyclonal antibody (Invitrogen, 14-9161-73) for 15 min at 37 °C. Following this, another 30 min of incubation at 4 °C was performed with the addition of Fixable Viability Dye eFluor 780 and the surface antibodies CD45RA and CD3. PBMCs were sorted for CD3+ T cells, and the most clearly distinguished naive CD45RA+CCR7+ fraction was excluded.
For ASCENT blood samples at LUSC diagnosis, Treg cell and non-naive non-Treg cell enrichment was performed by FACS. Cells were stained with CCR7 and an Fc receptor binding inhibitor polyclonal antibody (Invitrogen, 14-9161-73) for 15 min at 37 °C. Following this, another 30 min of incubation at 4 °C was performed with the addition of Fixable Viability Dye eFluor 780 and surface antibodies (a full antibody list is outlined in Supplementary Table 3, including CD45RA, CD3, CD4 and CD25).
For all cohorts, FACS was performed using BD FACSAria Fusion (BD Biosciences) at the Cancer Institute Flow Cytometry Core Facility. For UCLH bronchoscopy surveillance samples, only non-naive CD3+ cells were collected, whereas for ASCENT samples, Treg cells (CD4+CD25+) and non-naive CD4+ Tconv cells (CD4+CD25− and CD45RA−CCR7−) were collected. These were washed twice in PBS with 0.04% BSA and adjusted to 1,000 cells per µl for processing with a Chromium Next GEM Single Cell 5′ kit v.2, with VDJ TCR-seq amplification, according to manufacturer’s instructions.
PBMC flow cytometry
Cryopreserved PBMC samples were thawed as described above. Samples were resuspended in FACS buffer and stained with antibodies outlined in Supplementary Table 3.
For the UCLH bronchoscopy surveillance preinvasive samples, the plate was centrifuged and resuspended with a chemokine receptor antibody mix containing Fc receptor binding inhibitor polyclonal antibody (Invitrogen, 14-9161-73) and Brilliant Stain Buffer Plus (BD Biosciences, 566385). Samples were incubated at RT for 15 min followed by another 30 min of incubation at 4 °C with additional surface antibodies. Samples were washed twice with FACS buffer and fixed with FoxP3 Transcription Factor Fixation/Permeabilization Concentrate and Diluent solutions (Invitrogen eBioscience, 00-5521-00) for 30 min at RT. Cells were washed 3 times with 1× permeabilization buffer (Invitrogen, 00-8333-56) followed by 1 h of incubation with a cocktail of intracellular antibodies at RT. The plate was washed 3 times with 1× permeabilization buffer and resuspended with FACS buffer before sample acquisition on a FACSymphony A5 High-Parameter Cell Analyser (BD Biosciences).
For ASCENT and healthy donor samples, cryopreserved PBMCs were thawed as described above. Once plated, cells were incubated with Live/dead Fixable Blue at RT in the dark for 20 min. The cells were washed once in FACS buffer, then resuspended with a chemokine receptor antibody mix with Human TruStain FcX (BioLegend, 422302), True-Stain Monocyte Blocker (BioLegend, 426103) and Brilliant Stain Buffer Plus for 15 min at 37 °C. This was followed by 30 min of incubation at 4 °C with additional surface antibodies. Samples were washed twice with FACS buffer, fixed with FoxP3 Transcription Factor Fixation/Permeabilization Concentrate and Diluent solutions (Invitrogen, 00-5521-00) for 30 min at RT, washed and left overnight at 4 °C in FACS buffer. The following day, cells were washed 3 times with 1× permeabilization buffer (Invitrogen, 00-8333-56) followed by 1 h of incubation with a cocktail of intracellular antibodies at RT. The plate was washed 3 times and resuspended with FACS buffer before sample acquisition on an ID7000 Spectral Cell Analyser (Sony Biotechnology). Manual gating analysis for all cohorts was completed using FlowJo (v.10.8.1).
Primary tumour tissue collection, processing and spectral flow cytometry
Excess tumour and matched histologically normal adjacent parenchyma tissue resected from patients as part of their clinical care were selected by a pathologist and collected with patient consent as part of the ASCENT protocol (n = 4 stage I, n = 3 stage II, n = 1 stage III) or the Molecular Pathogenesis of Lung disease II protocol (n = 6 stage I, n = 1 stage II, n = 1 stage III). Tissue was stored in ice-cold collection medium (RPMI 1640 supplemented with 2.5% FBS, 1% penicillin–streptomycin) and processed by manual cutting into small tumour fragments of 1–2 mm3 size. Tumour fragments were mixed to ensure uniform representation of the tumour lesion, and 15–20 fragments were cryopreserved in FBS supplemented with 10% DMSO until further downstream use.
For flow cytometry analyses, cryopreserved fragments were thawed in a water bath at 37 °C, transferred to a 50 ml conical tube and washed 3 times with pre-warmed tumour wash medium (DMEM (ThermoFisher Scientific, 11995065) supplemented with 100 U ml–1 penicillin–streptomycin and 10% FBS) to remove all remaining DMSO. Tumour fragments were digested for 1 h at 37 °C with RPMI 1640 supplemented with 0.056 mg ml–1 collagenase II (Gibco, 17101-015), 45 U ml–1 collagenase IV (Gibco, 17104019), 0.025 mg ml–1 elastase (Promega, V1891), 0.025 mg ml–1 DNase, (Sigma, 10104159001), 10% FBS and 100 U ml–1 penicillin–streptomycin. Samples were then washed with PBS, filtered over a 100 µm cell strainer (Miltenyi, 130-110-917) and resuspended in PBS.
Fragments were then stained with a spectral flow cytometry T and B cell panel to assess the immune cell composition. Antibodies for each antibody cocktail are described in Supplementary Table 3. Cells were incubated using a Zombie NIR Fixable Viability kit at RT in the dark for 20 min. The samples were washed once in FACS buffer, then resuspended with a chemokine receptor antibody mix with Human TruStain FcX, True-Stain Monocyte Blocker and Brilliant Stain Buffer Plus for 15 min at 37 °C. This was followed by 45 min of incubation at 4 °C with additional surface antibodies. Samples were washed twice with FACS buffer, then fixed with True-Nuclear Transcription Factor Buffer Set (BioLegend, 424401) following the manufacturer’s instructions. Subsequently, samples were stained for 1 h with a cocktail of intracellular antibodies at RT. Samples were washed and resuspended in FACS buffer before sample acquisition on an ID7000 Spectral Cell Analyser (Sony Biotechnology). Manual gating analysis was completed using FlowJo (v.10.8.1).
Tissue processing for bulk RNA-seq
RNA was extracted from tumour tissue preserved in RNAlater Stabilization solution (Invitrogen, AM7020). Tissue was first dissected and homogenized using a TissueRuptor II probe (Qiagen, 9002755). DNA and RNA were extracted using an AllPrep DNA/RNA Mini kit (Qiagen, 80204), following the manufacturer’s instructions.
Extracted RNA was quantified on a Qubit 3.0 Fluorometer using a Qubit RNA High Sensitivity assay kit (Invitrogen, Q32852). RNA libraries were prepared using a maximum of 100 ng RNA with a Watchmaker RNA Library Prep kit and HMR Polaris Depletion (7K0077-096 and 7K0078-096) at UCL Genomics. High-yield, adaptor-dimer free libraries were checked using an Agilent TapeStation 4200 and a Qubit dsDNA Quantitation High Sensitivity kit (Invitrogen, Q32851) and were then pooled in equimolar solutions. Sequencing was performed using an Illumina NovaSeq 6000 platform.
DNA extraction from PBMCs for TCR-seq
DNA was extracted from cryopreserved PBMCs using a NucleoSpin Tissue Mini kit (Macherey-Nagel, 740952.50) according to the manufacturer’s instructions. Genomic DNA was eluted in two sequential steps using pre-warmed elution buffer (70 °C), with a total elution volume of 80 μl. DNA extraction from buffy coats was carried out using a QIAamp DNA Blood Mini kit (Qiagen, 51104), following the manufacturer’s instructions for maximum concentration.
Extracted DNA was quantified on a NanoDrop spectrophotometer and a Qubit 4 Fluorometer using a Qubit dsDNA Quantitation High Sensitivity kit. A total of 2–5 µg DNA (or 41–54 ng µl–1 in at least 72 µl) from each PBMC or buffy coat sample was sent for bulk deep TCR-seq using an AmpliSeq for Illumina TCR beta-SR panel (longitudinal SUMMIT–ASCENT), carried out at the FEST and TCR Immunogenomics Core Facility at Johns Hopkins University.
Mouse models and tissue profiling
All mouse studies were approved by the University College London Biological Services Review Committee (PPL number: PP2060881) and conducted following the UK Home Office procedural and ethical guidelines Animals (Scientific Procedures) Act 1986, in a specific pathogen-free facility. All mice were housed in individually ventilated cages (3–4 animals per cage) under a 12 h light–dark cycle at 22 ± 2 °C and 55 ± 10% relative humidity, with food and water available ad libitum. All female FVB/N mice were 4–5 weeks old at transfer from Charles River and underwent a 1-week acclimatization period before the start of NTCU dosing. To ensure comparable mean baseline weights in all in vivo experiments, cages were randomly assigned to treatment groups, ensuring comparable animal weights. In the FTY720, anti-CD25 and anti-CTLA-4 experiments, cages were randomized within the NTCU-treated arm to receive treatment or vehicle control. Blinding was not applied in these studies due to active dosing, health surveillance and body weight monitoring of mice that required knowledge of treatment allocation. In the PI3K inhibition experiments, a sample size calculation was performed based on previously observed difference in abundance of tumours in NTCU versus control mice, and was calculated using the pwr.t.test and pwr.anova.test functions from the Bioconductor pwr package with a Cohen’s f statistic of 0.75 and a Cohen’s d statistic of 1.5. Cages in the NTCU-treated arm were randomized at week 15 post-NTCU initiation to receive BYL719, PI-3065 or a vehicle diet. For this interception experiment, investigators were blinded to treatment allocations during all data collection and analyses of tumour incidence and size. Source data for all in vivo experiments are provided.
NTCU-induced lung carcinogenesis
The backs of 6-week-old female FVB/N mice were shaved before topical application of 75 µl of 13 mM NTCU (SC-2112265, Insight Biotechnology) dissolved in acetone. Topical application of NTCU, via micropipette, was repeated twice weekly for 12 weeks. Mice were maintained through a further observational period of up to 12 weeks. Tumour growth up to 1,200 mm3 in any two dimensions or tumours interfering with normal functions served as humane endpoints requiring a Schedule 1 procedure.
Tissue sample collection and processing
For tissue collection, mice were terminally anaesthetized by intraperitoneal injection of an overdose of 200 mg ml–1 pentobarbital (Dolethal, Vetoquinol) or inhaled isoflurane. Spleens and lymph nodes were digested for 15 min at 37 °C with 1.5 mg ml–1 collagenase D (Sigma, 11088882001), 0.1 mg ml–1 DNAse I, 6 mg ml–1 NADase (ThermoFisher, N9879) and 5% FBS in IMDM (Gibco, 12440061), before mechanical dissociation through a 40 µm cell strainer. For lung processing for flow cytometry and scRNA-seq (18-week time point), animals were perfused with 10 ml ice-cold PBS and all lung lobes were collected and placed in ice-cold PBS. Lungs were digested with 3 mg ml–1 collagenase III (Stemcell, 07422), 0.1 mg ml–1 DNase I, NADase 6 mg ml–1 and 5% FBS in IMDM for 75 min before mechanical dissociation through a 70 µm cell strainer and isolation of mononuclear cells using 40% isotonic Percoll PLUS (Merck, GE17-5445-01). For scRNA-seq preparation (15-week and 24-week time points), perfused lungs were mechanically dissociated and incubated with 500 U ml–1 collagenase type IV (Sigma, C4-BIOC) and 0.02 mg ml–1 DNase I in HBSS for 30 min at 37 °C. The cell suspension was then passed through a 40 µm cell strainer and cryopreserved for downstream analysis.
For longitudinal blood samples, sampling was performed by tail vein bleeding from KRT5-CreER;tdTomato FVB mice (MGI: 4358332, MGI: 3809523). Blood samples were collected in vials containing 0.5 mM EDTA to prevent clotting. Cardiac puncture was done under isoflurane anaesthesia and lymphocytes were isolated via Ficoll density gradient centrifugation. In spleen, lung and blood samples, erythrocytes were lysed with 1× RBC lysis buffer (ThermoFisher, 00-4300-54). RBC lysis was quenched with ice-cold PBS and cells were pelleted by centrifugation at 450g for 5 min at 4 °C before staining. For spatial transcriptomics, immunohistochemistry and multiplex immunofluorescence stainings, perfused lungs were inflated with 4% paraformaldehyde (ThermoFisher Scientific, J19943.K2) and fixed overnight at 4 °C for further histology processing.
Histology and immunostaining of mouse lungs
Paraffin-embedded lungs were sectioned at 4 µm on a microtome. For all immunostaining, paraformaldehyde-fixed paraffin embedded (FFPE) slides were dewaxed using an autostainer (TissueTek) and washed in PBS. Heat-mediated antigen retrieval was performed by submerging slides in 10 mM sodium citrate buffer (pH 6.0) or EDTA antigen retrieval solution (pH 9.0) (00-4956-58, Invitrogen). Sections were blocked with 5% donkey serum, 3% BSA, 0.1–0.25% Triton X-100 (Sigma-Aldrich, X100-5ML) and PBS blocking solution, then incubated with primary antibodies diluted in blocking solution overnight at 4 °C. The following primary antibodies were used: KRT5 (1:500, chicken, BioLegend, 905901); CD4 (1:200, rabbit, Abcam, Ab183685); FOXP3 (1:100, rat, ThermoFisher 14-5773-82); and CD8a (1:100, rat, ThermoFisher 14-0081-82). Secondary antibodies were conjugated to Alexa Fluor dyes (Life Technologies) and incubated at 3–4 h at RT or overnight at 4 °C. For both FOXP3 and CD8a staining, a TSA signal amplification kit (PerkinElmer, NEL70000KT) was used. Nuclei were counterstained with DAPI. Immunofluorescence images were acquired using a Leica DMi8 widefield microscope or a Zeiss 880 confocal microscope.
For KRT5 immunohistochemistry staining (1:1,000, rabbit, BioLegend, 905501), sections were quenched in 3% H2O2 for 10 min at RT before antigen retrieval, and then blocked in 2% goat serum (MP-7451, Vector Labs) for at least 30 min at RT. Slides were then incubated with Immpress polymer reagent (Vector Labs, MP-7451) for 30 mins at RT. Staining was detected using an ImmPact NovaRed substrate kit (SK-4805, Vector Labs) then counterstained with haematoxylin. Reference slides were stained with haematoxylin and eosin using an autostainer and imaged on a NanoZoomer (Hamamatsu). One mouse from the BYL719 arm of the interception experiment was euthanized before the experimental endpoint, after reaching an early humane endpoint, and was excluded from all downstream analyses presented in this manuscript.
NTCU-induced disease quantification
Using NDP.view2 (Hamamatsu, v.2.9.29) or Fiji ImageJ2 software (v.2.3.0/1.53q), intrapulmonary KRT5-expressing epithelium and total exposed airway were quantified. The proportion of total airway expressing KRT5 was calculated. Comparison to the corresponding haematoxylin and eosin-stained images enabled intrapulmonary KRT5-expressing epithelium to be separated into the following preinvasive lesion grades: flat atypia, low-grade and high-grade. Flat atypia was defined as a single-cell layer with flattened enlarged nuclei and increased nuclear to cytoplasmic ratio. Low-grade lesions consisted of a well-ordered multilayered epithelium. HGLs were defined as a multilayered disorganized epithelium with enlarged nuclei. This classification follows previously published grading criteria58. Tumours were defined as KRT5+ cells that had broken through the basement membrane in the alveolar space. Independent tumours were defined when separated by 200 µm of normal histology (that is, non-KRT5 expressing tissue). Tumour incidence and individual tumour size were calculated across two tissue depths (200 µm apart).
Lung and cardiac puncture (PBMC) single-cell preparation
Perfused lungs and isolated PBMCs from cardiac puncture were collected directly into ice-cold PBS and digested into a single-cell suspension as described above.
For samples collected at 15 and 24 weeks, CD45+ cell fractions were isolated via FACS (CD45 antibody; BD Biosciences, 559864, 1:100) or MACS (Miltenyi, 130-052-301), respectively. For samples collected at the 18-week time points, CD4+ CD25+ or CD3+ cell fractions were isolated by FACS (all antibodies used for staining are detailed in Supplementary Table 3). FACS was performed using BD FACSAria Fusion (BD Biosciences) at the Cancer Institute Flow Cytometry Core Facility. Gel beads in emulsion (GEMs) were generated from the cell suspensions, which facilitated individual cell barcoding, using a Chromium Next GEM Single Cell 5′ kit v.2 and a Chip K Single Cell kit (10x Genomics). TCR amplification was performed using a Chromium Single Cell Mouse TCR Amplification kit (10x Genomics). Both TCR and gene expression complementary DNA libraries were generated, and library quality was assessed using a bioanalyser. Sequencing was performed on an Illumina NovaSeq 6000, with 150 bp paired-end sequencing.
Flow cytometry analysis of mouse tissues
All antibodies used for staining are detailed in Supplementary Table 3. Single-cell suspensions were stained with a Zombie NIR Fixable Viability kit for 20 min at RT, then washed in FACS buffer. Cell pellets were incubated with surface chemokine receptor antibodies with anti-CD16/CD32 Fc block (BioLegend, 156604), Brilliant Stain Buffer Plus and True-Stain Monocyte Blocker for 15 min at 37 °C. Extracellular antibody cocktail was incubated in FACS buffer for 30−45 min at 4 °C. Cells were then washed twice, fixed and permeabilized with TrueNuclear Transcription Factor Buffer Set per the manufacturer’s instructions. Intracellular targeted antibodies were incubated for 60 min at RT. 123count eBeads Counting Beads (ThermoFisher Scientific, 01-1234-42) were added before acquisition to quantify total lymphocytes per tissue. Spectral flow cytometry was performed on an ID7000 Spectral Cell Analyser (Sony Biotechnology). Manual gating analysis for all cohorts was completed using FlowJo (v.10.8.1).For flow cytometric analyses in the lymph nodes and lungs, samples with fewer than 50 events in the FOXP3+ Treg or migratory cDC gates were excluded to ensure sufficient events for reliable quantification of the target population.
PI-3065 and BYL719 drug administration
At 15 weeks after the first NTCU application (3 weeks into the observational period), the conventional rodent diet was replaced randomly among the NTCU-treated mice with either control 2018 rodent diet or 2018 rodent diet containing 0.5 g kg–1 PI-3065, corresponding to a daily dose of 75 mg kg–1 PI-3065, or containing 66.6 mg kg–1 BYL719, corresponding to a daily dose of 10 mg kg–1 BYL719, formulated by Envigo. This food was available ad libitum for the remaining duration of the NTCU experiment. The average mouse weight across cages was constant across the experimental groups at the time of diet change (22.16–22.3 g) and the study was run blinded to avoid experimental bias.
FTY720 drug administration
To inhibit lymphocyte lymph node egress, 18-week (after NTCU treatment initiation) mice were treated by intraperitoneal injection with 1 mg kg–1 FTY720 (Merck, SML0700-5MG) or saline vehicle for 3 consecutive days before tissue collection.
Anti-CD25 and anti-CTLA-4 administration
At 18 weeks after NTCU treatment initiation, mice were treated with 2 intraperitoneal injections of either of mIgG2a anti-CD25-NIB48 or mIgG2a anti-CTLA-4 (clone 9D9): 200 μg per mouse 72 h before tissue collection and 100 μg per mouse 24 h before tissue collection.
Determination of in vivo PI-3065 activity
As demonstrated in previous literature42,46, systemic PI3Kδ inhibition is characteristically found to result in almost complete loss of marginal zone B cells (B220+CD21+CD23−) and reduced Treg cells (CD4+CD25+FOXP3+) in the spleen. The splenic composition of PI-3065-treated and vehicle-treated mice was analysed by flow cytometry after thawing of the cell suspension and removal of dead cells by MACS dead cell depletion (Miltenyi Biotec, 130-090-101; method as described above).
Xenium spatial transcriptomic data generation
Mouse FFPE whole-lung sections were profiled using a 10x Genomics Xenium platform with a Mouse 5K Pan-Tissues and Pathways panel, with optional Cell Segmentation Staining enabled. Eight samples collected at week 24 were analysed, including two age-matched controls, three NTCU-treated mice and three NTCU-treated PI-3065-dosed mice. Samples were selected and sectioned to achieve comparable bronchial tree coverage across animals. Tissue preparation, deparaffinization, decrosslinking, probe hybridization, amplification, segmentation staining and cyclic imaging were performed according to the manufacturer’s Xenium Prime FFPE workflows and user guidance (10x Genomics; CG000578, CG000580 and CG000760).
Generation and culture of in vitro mouse trachea organoids
Terminally anaesthetized mice were transcardially perfused with sterile, ice-cold PBS before tissue collection. Tissues were placed in ice-cold PBS, and the trachea and mainstem bronchi were separated from the intrapulmonary airways at the lung junction. Extratracheal tissues were removed using a dissection microscope. The trachea and mainstem bronchi were transferred to Dispase (Corning, 354235) and incubated at 37 °C for 40 min. The epithelial layer was then flushed out with ice-cold PBS using a syringe fitted with a 25 G needle and collected by centrifugation at 350g for 3 min at 4 °C. Cell pellets were resuspended in TrypLE (Gibco, 12605010) and incubated at 37 °C for 10 min, followed by filtration through a 40 µm cell strainer and centrifugation for 3 min at 350g. The resulting cell pellet was washed with cold PBS, pelleted again and resuspended in Matrigel (Corning, 354230). Single cells embedded in Matrigel were overlaid with self-renewal medium59 supplemented with 10 μM Y-27632 ROCK inhibitor (Biotechne, TB1254-GMP). After 3 days, Y-27632 was removed from the culture medium, and the organoids were maintained for subsequent experiments.
PI-3065 in vitro experiment with EdU Click-iT cell cycle flow cytometry assay
Organoids were incubated with 10 μM EdU overnight (18 h) in the presence of control DMSO (0.1%) or with 1 µM or 5 µM PI-3065 (n = 4 per group). Following incubation, organoids were dissociated with TrypLE for 15 min at 37 °C. An EdU Click-iT Flow Cytometry Assay kit (Invitrogen, C10633) was then used to determine the percentage of S phase cells according to the manufacturer’s instructions. Flow cytometry data were analysed using FlowJo (v.10.8.1).
Computational analysis
Single-cell data pre-processing and quality control
Raw sequencing data were processed using Cell Ranger (v.7.1.0; 10x Genomics; https://www.10xgenomics.com/support/software/cell-ranger/latest) to demultiplex FASTQ files, align reads to the GRCh38 or GRCm38 reference transcriptome and to generate gene-by-cell UMI count matrices.
Cell-level quality control was performed based on the number of detected genes per cell and the proportion of mitochondrial gene counts. Cells were excluded if they contained fewer than 250 detected genes or if the number of detected genes was greater than three median absolute deviations from the sample-level median. Cells with mitochondrial gene counts exceeding 20% of total counts were also removed. Genes with zero expression across all retained cells were excluded from downstream analyses.
Single-cell data integration and clustering
Seurat60 (v.4.4.1) was used to normalize the raw count matrices, identify highly variable features, scale gene expression and integrate samples. Highly variable features were identified using the variance-stabilizing transformation (‘vst’) method, with the top 3,000 most variable features used for principal component analysis (PCA). Immunoglobulin, T cell receptor, selected mitochondrial and type I interferon response genes were excluded from clustering to reduce the influence of technical effects or dominant transcriptional programmes un core cell identity61. Dimensionality reduction was performed using RunPCA(), followed by RunUMAP() using the first 30 principal components.
Clusters were annotated using a multistep approach. First, cluster-specific marker genes were identified from the differential expression analysis using Seurat’s FindAllMarkers() function, using a two-sided Wilcoxon rank-sum test, and genes with adjusted P < 0.05 were retained. Second, cells were mapped to the Human Lung Cell Atlas62 (HLCA v.2) reference using RunAzimuth() from the Azimuth package (v.0.5.0). Finally, cluster identities were validated via gene set enrichment analysis (using fgsea v.1.34.2) based on NES values, using immune and non-immune gene signatures35,63,64,65 and T cell gene signatures6,19,25,66,67.
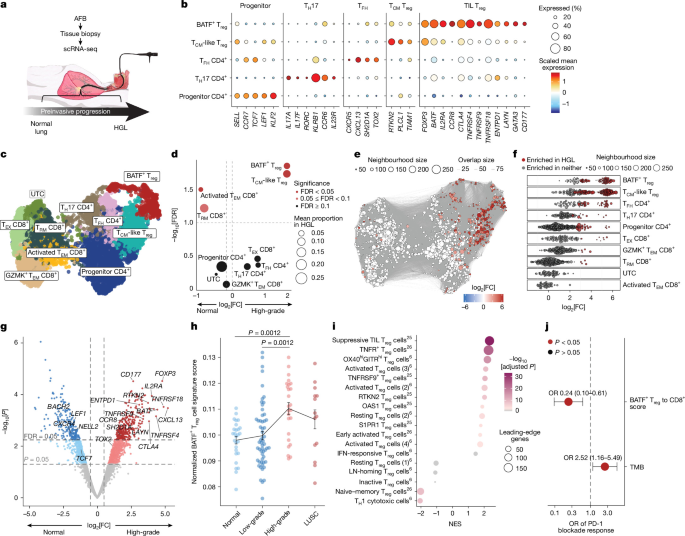
Single-cell datasets were integrated in Seurat using the standard anchor-based workflow. Raw count matrices were normalized, highly variable features were identified and integration features were selected using SelectIntegrationFeatures(). Integration anchors were identified with FindIntegrationAnchors() using canonical correlation analysis reduction, followed by batch correction and generation of the integrated object with IntegrateData(). This methodology was extended to construct a large-scale integrated T cell atlas consisting of 255,266 cells from 461 samples across 271 patients, incorporating the primary human preinvasive LUSC cohort alongside external datasets from the Pre-Cancer Genome Atlas (PCGA)22, a preinvasive lung adenocarcinoma study (pre-LUAD)21,23 and a lung single-cell atlas20. Following integration, the data were scaled, and dimensionality reduction was performed using the RunUMAP() function. For the integrated atlas analysis (Extended Data Fig. 1e,f), enrichment of T cell subsets relative to normal tissue was assessed using a quasi-Poisson regression model24, including dataset as a covariate and the total number of CD4+ T cells per sample as an offset, with significance determined using Wald’s tests.
scRNA-seq analysis of differential abundance of T cell types using miloR
Differential abundance of T cell states in the human UCLH bronchoscopy surveillance scRNA-seq dataset and the integrated atlas were assessed using miloR68 (v.2.4.1). Samples were excluded owing to low cell number and/or histological annotation unsuitable for normal versus HGL comparisons (see Supplementary Table 1 for specific exclusions). The Seurat objects were converted to a SingleCellExperiment (v.1.30.1) object and then to a Milo object. A k-nearest-neighbour graph was built on the PCA embedding using buildGraph (k = 30, d = 25), and neighbourhoods were generated using makeNhoods(prop = 1, k = 30, d = 25, refined = TRUE). Cells were counted per sample using countCells(), neighbourhood distances were calculated using calcNhoodDistance (d = 25), and differential abundance between normal and high-grade samples was tested using testNhoods() with pathology status as the design variable. Neighbourhoods were annotated on the basis of the dominant cell type using annotateNhoods(), and significant neighbourhoods were defined as those with spatial FDR < 0.1. For plotting, log2(FC) values were sign-adjusted so that positive values indicated enrichment in high-grade samples.
Pseudobulk and differential gene expression analysis of scRNA-seq data
For comparative gene expression analysis between disease states, such as high grade versus normal (Fig. 1g), or between specific cell phenotypes (Fig. 4h), a pseudobulk method was used. For pseudobulk differential expression analysis, ambient RNA contamination was first estimated and removed using decontX() from the celda package (v.1.26.0), with cell-type labels provided as priors to the latent Dirichlet allocation model. Decontaminated counts were then aggregated by patient and pathology group using the pseudobulk() function from the glmGamPoi package (v.1.22.0). Gene-level counts were imported into a DGEList object using edgeR (v.4.8.2) and filtered using the filterByExpr() function to retain genes with sufficient expression across samples for differential expression analysis. We further excluded genes that had matching patterns associated with non-informative or confounding signals, including mitochondrial, ribosomal, TCR and BCR subunits (TRA, TRB, IGH, IGK and IGL), and specific nuisance transcripts (for example, HIST, LINC and HB), before downstream modelling. The data were normalized using the trimmed mean of M-values method. Differential expression between high-grade and normal samples was performed using the limma-voom framework in limma (v.3.66.0). To account for the patient-matched nature of the samples, a linear model was fitted with a paired design (~ patient + pathology). To propagate the reliability of each pseudobulk sample into the model, we used cell-count weights during the lmFit() stage. Significance was determined using the empirical Bayes method with robust hyperparameter estimation. P values were adjusted for multiple testing using the Benjamini–Hochberg FDR procedure.
scRNA-seq gene set enrichment analysis
In the human data, pseudobulk expression profiles were generated by aggregating single-cell counts at the cell type × patient × pathology level. BATF+ Treg cell pseudobulk data were compared against pseudobulk data from all other T cell subsets, using edgeR to identify genes preferentially enriched in BATF+ Treg cells. Genes were ranked using a signed likelihood ratio statistic, defined as sign(log(FC)) × likelihood ratio. Published Treg cell signatures6,25,26 were tested for enrichment across this ranked BATF+ Treg cell differential expression profile using fgseaMultilevel() from fgsea (v.1.34.2). To evaluate functional enrichment across a subset of mouse lung-resident CD4+ clusters, significantly upregulated genes (P ≤ 0.05, log(FC) > 0) were ranked by log(FC) and analyzed against MSigDB Hallmark and WikiPathways gene sets (via msigdbr). NESs and nominal P values (*P ≤ 0.05, **P ≤ 0.01, ***P ≤ 0.001) were visualized using ggplot2. To enable cross-species gene set enrichment analysis, human gene symbols from published literature signatures and pseudobulk profiles were mapped to their corresponding mouse orthologues using the Mouse Genome Informatics (MGI) human–mouse orthology database (The Jackson Laboratory) at the time of data analysis. NES values, adjusted P values and leading-edge genes were extracted, and NES values were visualized by dot plot for the human UCLH bronchoscopy surveillance cohort and the NTCU mouse model.
Associated bulk transcriptome analysis of scRNA-seq data
Bulk transcriptomic data from human bronchial biopsy samples were obtained from NCBI GEO accession GSE33479 (ref. 13). This dataset comprises 122 biopsy samples from 77 patients, including 13 samples with normal histology and normofluorescent (normal), 14 with normal histology and hypofluorescent (normal), 15 hyperplasia (low-grade), 15 metaplasia (low-grade), 13 mild dysplasia (low-grade), 13 moderate dysplasia (low-grade), 12 severe dysplasia (high-grade), 13 CIS (high-grade) and 14 squamous cell carcinoma (LUSC).
To assess BATF+ Treg cell signature expression across disease states, BATF+ Treg cell signature genes derived from pseudobulk differential expression analysis were filtered for log(FC) > 0.25 and P < 0.05, after excluding low-information gene families, including immunoglobulin, TCR, haemoglobin, histone and long intergenic noncoding RNA genes. The top 300 retained genes, ranked by log(FC), were used to calculate a sample-level BATF+ Treg cell signature score as the geometric mean of expressed signature genes. Differences in BATF+ Treg cell signature scores across tissue states were assessed using a linear mixed-effects (LME) model, BATFTreg ~ tissue_type + (1|patient_id), followed by emmeans() pairwise contrasts with Benjamini–Hochberg correction for multiple testing.
MHCII signalling pathway and cell–cell communication analysis of scRNA-seq data
MHCII genes (HLA-DRB1, HLA-DQB1, HLA-DQA2, HLA-DQB2 and HLA-DPB1) were used to calculate the MHCII UCell score using the AddModuleScore_UCell() function from the UCell package29 (v.2.12.0). This function calculates a score for the MHCII gene set for every cell. UMAPs showing UCell score of MHCII were constructed to visualize MHCII expression in cell types between normal and high-grade using scRNA-seq of human UCLH bronchoscopy surveillance data.
To identify crosstalk axes involving BATF+ Treg cells, we used the R package CellChat69 (v.2.2.0) on the integrated Seurat object, analysing normal and high-grade samples separately. After merging the T cell and myeloid Seurat objects together, we used the ‘createCellChat()’ function to form an object compatible for CellChat analyses. We then curated a human ligand–receptor database (CellChatDB.human) so that CellChat understands which gene pairs can act as signalling links. We used the subsetData() function to restrict the analysis to genes represented in the CellChatDB human database. We enabled parallel processing using the future (v.1.33.1) R package. CellChat identified genes that are overexpressed in each cell group from the ‘identifyOverExpressedGenes()’ function and then keeps only ligand–receptor pairs in which the ligand is overexpressed in a putative sender group and the receptor is overexpressed in a receiver group, using the ‘identifyOverExpressedInteractions()’ function. For filtered pairs, computeCommunProb (type = ‘triMean’) estimated interaction probabilities that combine ligand expression, receptor expression and the fraction of cells expressing each gene. The ‘triMean’ option favours fewer but higher-confidence links. We then removed interactions involving cell groups with fewer than 50 cells using filterCommunication(). Individual ligand–receptor interactions annotated to the same CellChat signalling pathway were combined using computeCommunProbPathway() to generate a pathway-level communication score. These pathway-level scores were then summarized across sender–receiver pairs using aggregateNet(), which produced condition-specific cell–cell communication networks. This was performed separately for normal and high-grade CIS cells so that we could compare the differences in cell–cell interactions between disease states.
Ligand–receptor interactions identified through the CellChat workflow detailed above were validated in a bulk microarray dataset13. HGLs and normal lesions were selected for validation. Only ligands and receptors identified through CellChat (Extended Data Fig. 2i,j) were tested. For each gene, we performed a two-sided Wilcoxon rank-sum test comparing high-grade versus normal samples and computed log2(FC). Resulting P values were Benjamini–Hochberg adjusted. Genes were annotated by role (ligand or receptor) and the direction of change (enriched in high-grade or normal tissue). This procedure provides an independent, cohort-level assessment of the direction and significance of receptor–ligand interaction gene modulation in HGLs relative to normal tissue.
Pseudotime trajectory analysis of scRNA-seq data
For pseudotime analysis (Figs. 2i,j and 4l), we first subsetted the relevant CD4+ T cell populations from the integrated Seurat objects. Trajectory inference was then performed using Monocle3 (v.1.3.4) R package. The Seurat object was converted to a Monocle3 cell_data_set object using the new_cell_data_set() function by transferring the raw RNA count matrix, cell metadata and gene annotations. In Monocle3, expression values were pre-processed and principal components were calculated with 50 dimensions using preprocess_cds(num_dim = 50). To maintain consistency with the clustering and integration analyses performed in Seurat, the low-dimensional structure was not recomputed de novo in Monocle3. Instead, the uniform manifold approximation and projection (UMAP) embeddings and cluster labels previously generated in Seurat were transferred directly into the Monocle3 object and used for graph learning. All cells were assigned to a single partition, enabling Monocle3 to learn one global trajectory graph across the selected CD4 subsets. The trajectory graph was then inferred using learn_graph() function, which constructs a principal graph representing the inferred lineage structure across UMAP. To define UMAP directionality, pseudotime was oriented by manually rooting the graph in the most transcriptionally naive or early-state population, defined as Progenitor CD4 lesion in the human dataset and naive-like CD4 in the mouse dataset. Cell-level pseudotime values were then calculated using order_cells() and exported for downstream visualization and analysis. Pseudotime values for each cell were extracted for visualization.
Paired scTCR-seq sharing bias analysis
To quantify whether BATF+ or eTreg cell-associated clonotypes were preferentially shared with specific CD4+ or Treg cell phenotypes, we modelled clonal sharing using binomial generalized LME models. In human analyses, lesion BATF+ Treg cell clonotypes were defined as source clonotypes and tested for enrichment among other lesion or matched PBMC CD4+ and Treg cell target phenotypes. In mouse analyses, lung BATF+ Treg cell clonotypes were used as source clonotypes to identify sharing with other lung phenotypes. Alternatively, blood eTreg cell clonotypes were used as a source with all lung phenotypes as targets. For each source clonotype, the binary outcome indicated its detection in the specified target phenotype. Models adjusted for source clonal expansion size, included a logit-link offset for target phenotype background abundance, and used a random intercept for patient or mouse. ORs and 95% CIs were derived from model coefficients, and P values were estimated using Wald z-tests.
High-dimensional clustering of flow cytometry data
Clustering of flow cytometry data was performed using a published workflow70, but with modifications. Consistent numbers of cells were exported from FlowJo for every sample and analysis was completed in R. FCS files underwent signal acquisition quality control using the FlowAI package (v.1.24)71. Data were arcsinh-transformed using the prepData() function from the CATALYST package (v.1.32.1)72, with a cofactor of 150 for standard fluorescence flow cytometry data from the UCLH bronchoscopy surveillance cohort and 550 for spectral flow cytometry data from the ASCENT cohort. Markers with poor contribution to phenotypic variance or poor staining were excluded before clustering, based on the PCA-derived non-redundancy score and analysis on FlowJo, as previously described70. CD103, TIM-3, TCF-1, CXCR4 and TIGIT were excluded from clustering owing to poor marker separation in the UCLH bronchoscopy surveillance cohort, and were also excluded from the ASCENT cohort to maintain consistency between panels. CD4 was also excluded because the FCS files only included CD4+ T cells.
Cells were clustered using FlowSOM (v.2.2.0)73 implemented through the CATALYST cluster() function, onto a 10 × 10 node square self-organizing map. Nodes were subsequently metaclustered using ConsensusClusterPlus (v.1.58.0)74, as previously described70. Metaclusters were manually annotated and merged based on median marker expression, similarity in UMAP space and established T cell phenotypes. UMAP dimensionality reduction was performed post-clustering using the ‘runDR()’ function, and marker expression was used to visualize phenotypic relationships between annotated clusters. We merged the resulting clusters using marker expression similarity, grouping of cells in UMAP space and knowledge of canonical T cell lineage features from the literature.
Bulk TCR-seq quality control
Raw tsv files were processed to include only productive sequences. To pass quality control, repertoires required a minimum of 1,000 unique clones and ≥3 counts per CDR3B sequence to limit the effect of naive cells and sequencing artefacts.
Pre-processing of bulk RNA-seq data
Raw sequencing reads from the ASCENT cohort were processed using the nf-core/rnaseq pipeline (v.3.12.0)75. In brief, reads underwent quality assessment with FastQC and adapter and quality trimming with Trim Galore, followed by alignment to the Homo sapiens GRCh38 reference genome using STAR76. Transcript abundances were quantified using Salmon77 in alignment-based mode from the STAR alignments, and transcript-level estimates were subsequently summarized to gene-level count matrices and transcripts-per-million values using tximport78. Quality control metrics generated throughout the workflow were aggregated into a single MultiQC report79. Ensembl release 112 gene annotation was used throughout the alignment and quantification workflow.
Xenium spatial transcriptomic data pre-processing and integration
Xenium outputs were imported into Seurat using BPCells (v.0.3.0) to enable on-disk storage of large count matrices. Cells were filtered to retain those with ≥20 endogenous transcripts per cell after removal of negative and system probes. Analyses were restricted to manually selected lung lobe regions of interest, with non-lung structures (for example, lymph node, thymus and oesophagus) excluded from the integrated lung object. Counts were log-normalized (Seurat v.5.3.1), and 2,000 highly variable genes were selected from detected panel genes. Dimensionality reduction was performed using a sketch-and-project strategy, fitting PCA on a 100,000-cell LeverageScore sketch, followed by Harmony (v.1.2.3) batch correction using sample ID and the first 30 principal components. UMAP was computed on Harmony embeddings, and SNN-Louvain clustering was performed; embeddings and cluster labels were projected to all cells. Marker genes were identified using FindAllMarkers().
Xenium downstream analysis
Clusters were annotated using canonical markers and consolidated into harmonized cell type labels across epithelial, stromal and immune compartments, with obvious doublets or low-identity populations flagged as contaminants. Immune aggregates were defined as spatially compact immune cell groupings (minimum 10 cells) using a 30 µm connectivity criterion, excluding diffusely distributed innate populations (alveolar macrophages, neutrophils, mast cells and monocytes). Peribronchial analyses quantified Treg cell distance to the bronchial tree (near 0–100 µm versus far >100 µm), immune aggregate number and size, and within-aggregate cell type composition, summarized at the mouse level for between-group comparisons.
Statistics and reproducibility
Statistical analysis
All statistical tests were performed in R (v.4.5.1), using the RStudio IDE (v.2026.01.1+403). Group comparisons were performed using Wilcoxon rank-sum tests or t-tests as appropriate, implemented with wilcox.test() or t.test() from the R stats package (v.4.5.1). When repeated measurements, paired regions or non-independent observations were analysed, LME models were fitted using lme4 (v.1.1-37), with the relevant biological unit included as a random intercept. Tests were two-sided unless a directional hypothesis was pre-specified; one-sided tests are indicated in the relevant figure legends. Where required, P values were adjusted for multiple testing using the Benjamini–Hochberg method, implemented with the p.adjust() function from the stats package.
Multivariable logistic regression models to account for potentially confounding variables were performed using Firth’s penalized likelihood method via the logistf package (v.1.26.1). This approach was selected to reduce small sample bias and mitigate non-convergence due to complete or quasi-complete separation. Model coefficients were exponentiated to obtain ORs with 95% CIs.
For longitudinal tracking of circulating immune populations in mouse models, treatment effects over time were assessed using a mixed repeated-measures analysis of variance, defining time point as the within-subject factor and treatment group as the between-subject factor.
Data visualization was performed primarily using ggplot2 (v.4.0.1), with additional plot annotation, layout and specialized visualization using ggpubr (v.0.6.2), ggrepel (v.0.9.6), ggbeeswarm (v.0.7.3), ggridges (v.0.5.7), ggtern (v.4.0.0), scales (v.1.4.0), patchwork (v.1.3.2), cowplot (v.1.2.0), pheatmap (v.1.0.13), ComplexHeatmap (v.2.24.1), circlize (v.0.4.16) and survminer (v.0.5.1). UMAP and flow cytometry plots were generated using Seurat and CATALYST plotting functions where appropriate. For TCR sharing Circos visualization only, PBMC ribbon widths were scaled down tenfold where required to improve readability; statistical sharing analyses used unscaled clonotype counts. GraphPad Prism (v.11.0.2) was used for visualization of selected flow cytometry analyses.
DFS analysis
Patients in the ASCENT early-stage NSCLC cohort were stratified into high and low groups based on a median split of the cross-tissue effector Treg cell circuit score (the product of the percentile ranks of the peripheral CD39+ eTreg cell frequency and the intratumoural BATF+ Treg cell RNA signature). In this cohort, cancer stage was I for 76 (85.4%), II for 6 (6.8%), and III for 6 patients (6.8%), with stage information missing for 1 patient (1.1%). DFS was defined as the time from surgical resection to the date of disease recurrence or death from any cause. Patients alive and without recurrence were censored at the date of their last recorded clinical follow-up. Survival probabilities were estimated using the Kaplan–Meier method and compared using the log-rank test via the survival package (v.3.8-6). For multivariable analysis, Cox proportional hazards models were used to estimate HRs, adjusting for age (standardized per standard deviation), smoking status, sex, stage and flow cytometry batch.
Reporting summary
Further information on research design is available in the Nature Portfolio Reporting Summary linked to this article.