
Patient sample collection
Metastatic tumour samples constituting the UW TMAs were collected from patients with metastatic castration-resistant prostate cancer at the UW–Fred Hutchinson Cancer Center (FHCC) after informed consent under Institutional Review Board approval (IRB number 2341). Samples were collected at the time of rapid autopsy.
Ethics statement
All animal work was performed in compliance with the protocol (number 50870) approved by the Fred Hutchinson Cancer Center Animal Care and Use Committee. Mice were housed under standard temperature and humidity conditions with a 12-h light–12-h dark cycle in the animal facility at the FHCC. Mice were closely monitored to minimize discomfort, distress, injury and pain throughout the in vivo experiments.
Cell culture
LNCaP (LNCaP clone FGC; American Type Culture Collection (ATCC), CRL-1740, RRID: CVCL_1379), C4-2B (ATCC, CRL-3315, RRID: CVCL_4784), 22RV1 (ATCC, CRL-2505, RRID: CVCL_1045), DU145 (ATCC, HTB-81, RRID: CVCL_0105) and PC3 (ATCC, CRL−1435, RRID: CVCL_0035) cells were cultured in RPMI-1640 medium (Gibco, 11875119) supplemented with 10% FBS, 1% GlutaMax (Gibco, 35050061) and 1% penicillin–streptomycin (Gibco, 15140122) and passaged using 0.05% trypsin-EDTA (Gibco, 25300120). VCaP (ATCC, CRL-2876, RRID: CVCL_2235) and HEK293T (ATCC, CRL-3216, RRID: CVCL_0063) cells were cultured in DMEM high-glucose medium (Gibco, 11965118) supplemented with 10% FBS and 1% penicillin–streptomycin and passaged using 0.05% trypsin-EDTA. LNCaP-abl (RRID: CVCL_4793) cells were cultured in RPMI-1640 without phenol red (Gibco, 11835055) supplemented with 10% charcoal-stripped FBS (Gibco, 12676029) and 1% penicillin–streptomycin and passaged using TrypLE without phenol red (Gibco, 12604039). LNCaP AD and LP cells and C4-2B AD and LP cells were cultured in neural stem cell medium consisting of advanced DMEM/F12 (Gibco, 12634028) supplemented with 10 ml B-27 supplement (50×) (Gibco, 17504044), 1% GlutaMax, 10 ng µl−1 bFGF (PeproTech, 100-18B-100UG), 10 ng µl−1 EGF (PeproTech, AF-100-15-100UG) and 1% penicillin–streptomycin. All cell lines were cultured at 37 °C with 5% CO2. LP lines were generated as previously described37.
Mice
Hi-Myc mice (Tg(ARR2/Pbsn-MYC)7Key, RRID: MGI:5486199) were bred with n-Trtct2–/– mice (C57BL6/J|6J.6N-rs46447118, n-Trtct2(-3_90del)) to generate Hi-Myc;n-Trtct2+/– mice with one copy of the Trr-Tct1-1 gene. TRAMP mice (C57BL/6-Tg(TRAMP)8247Ng/J, RRID: IMSR_JAX:003135) were bred with n-Trtct2OE mice (B6J-Tg(tRNA-Arg-TCT-1-1)529Slac) to generate TRAMP;n-Trtct2OE mice. NSG male mice (8–12 weeks old) for in vivo metastasis assays were obtained from the Comparative Medicine Translational Research Model Services Core at the FHCC. For in vivo studies, no formal sample size calculation was performed. Sample sizes were based on prior studies using similar animal models and experimental endpoints.
Mouse prostate organoid establishment and culture
Prostates from 8–12-week-old Hi-Myc;n-Trtct2+/+ and Hi-Myc;n-Trtct2+/– male mice were collected and dissected in DMEM medium supplemented with 10% FBS, 1% GlutaMax and 1% penicillin–streptomycin. Prostate lobes were microdissected using a clean blade followed by incubation with collagenase I (Gibco, 17018029) for 1 h at 37 °C and trypsin-EDTA 0.05% for 5 min on a 37 °C rocker. Enzyme reaction was quenched by adding dissecting medium containing 1 mg ml−1 DNase (Sigma, 101041590010). Enzyme-dissociated prostates were mechanically dissociated two or three times using a 3 ml syringe with an 18 G needle and filtered through a 40 μm cell strainer. The dissociated prostates were centrifuged at 350g for 5 min and resuspended in 1 ml dissecting medium for cell counting and stained with 3 μl each of CD49F-PE (R&D Systems, FAB13501P, RRID: AB_357017) and EpCAM-APC (BioLegend, 118214, RRID: AB_1134102) antibodies. Isolated prostate cells were enriched for basal stem cell populations (CD49F-positive and EpCAM-positive) by FACS and collected in DMEM medium with 50% FBS, 1% GlutaMax and 1% penicillin–streptomycin. FACS-sorted prostate basal cells were spun down at 350g for 4 min and resuspended in Matrigel for organoid culture (about 20,000 cells per well) in 24-well ultralow attachment plates (Corning, 3473). A total of 500 μl organoid medium (Advanced DMEM/F12 supplemented with B-27 supplement, 10 mM HEPES, 1% GlutaMax, 1% penicillin–streptomycin, 500 ng ml−1 R-spondin, 100 ng ml−1 Noggin, 0.1 g N-acetyl-l-cysteine, 200 nM A83-01, 50 ng ml−1 EGF and 10 μM Y-27632) containing 1 nM DHT was added per well and passaged using TrypLE.
Mouse genotyping
Mouse tissues were incubated in tail lysis buffer (100 mM Tris pH 8, 400 mM NaCl, 8 M urea, 20 mM EDTA pH 8 and 1% N-lauroylsarcosine sodium salt) with proteinase K (1.67 mg ml−1) overnight at 55 °C. DNA was extracted from lysed mouse tissue samples using phenol–chloroform–isoamyl alcohol (Ambion, AM9732) followed by ethanol precipitation. Genotyping PCR was conducted using GoTaq Green master mix (Promega, PRM7123) using the primers presented in Supplementary Table 9. The PCR products were analysed by agarose gel electrophoresis.
Cloning and plasmid preparation
TRR-TCT1-1, tRNA2
Arg(CCG) and tRNA3
Arg(UCG) knockdown by shRNA (Tet-pLKO-puro)
The EYFP sequence was cloned into Tet-pLKO-puro (Addgene, 21915) by Gibson assembly (NEB, E2611L). shScramble, shUCU, shCCG and shUCG oligonucleotide sequences (see Supplementary Table 9 for details) were amplified using Q5 high-fidelity 2× master mix (NEB, M0492S) and cloned into Tet-pLKO.1-puro-EYFP using Gibson assembly following enzyme digest with AgeI and EcoRI.
Overexpression of tRNAArg(UCU) isodecoders and TRR-ACG1-1, TRR-CCG2-1 and TRR-CCT4-1 (pLKO.1 puro)
For overexpression of tRNAArg(UCU) isodecoders, three tandem repeats of tRNA1Arg(UCU), tRNA2Arg(UCU), tRNA3Arg(UCU), tRNA4Arg(UCU) and tRNA5Arg(UCU) and their flanking sequences around the genomic loci (±200 bp) (see Supplementary Table 9 for details) were cloned into pLKO.1 puro (Addgene, 8453) following deletion of the U6 promoter region using ClaI and AgeI.
For overexpression of tRNAArg isodecoders from different isoacceptor groups, plasmids were generated by inserting three tandem repeats of tRNA1Arg(ACG), tRNA2Arg(CCG) or tRNA4Arg(CCU) and flanking sequences around the genomic loci (±200-bp) (see Supplementary Table 9 for details) to pLKO.1 puro without the U6 promoter.
AGA reporter assay (pLJM1-YFP)
pLJM1-YFP plasmid (modified from pLJM1-EGFP from D. Sabatini, Addgene, 19319) was digested with AgeI and EcoRI to replace YFP with Flag-mCherry−12×AGA-DHFR by Gibson assembly. Finally, EBFP2-intron-IRES was inserted into the plasmid following enzyme digest with AgeI. See Supplementary Table 9 for gBlock and primer sequences.
Following enzyme digest of the 12× AGA reporter plasmid with EcoRV and PmeI, 2×, 4× and 6× AGA reporters were generated by inserting mCherry and DHFR fragments following PCR with primers listed in Supplementary Table 9. In the 6× AGA reporter, two 6× AGA codon repeats were separated by CGU-CGA-CGU-CGA codons. In the 4×AGA reporter, three 4×AGA codon repeats were separated by CGU-CGA codons. In the 2×AGA reporter, six 2×AGA codon repeats were separated by CGA codons (Extended Data Fig. 9a).
SMARCC2 codon switch plasmid (pLVV-CMV-PGK-BSD)
SMARCC2 cDNA sequences with AGA codons either not switched or switched to CGC were linked to 3×Flag and inserted into pLVV-CMV-PGK-BSD following enzyme digest with XhoI and BamHI.
shSMARCC2 (pLKO.1-blast)
shScramble and shSMARCC2 oligonucleotide sequences (see Supplementary Table 9 for details) were cloned into pLKO.1-blast (Addgene, 26655) by Gibson assembly following enzyme digest with AgeI and EcoRI.
Generation of stable cell lines
The C4-2B TRR-TCT1-1 gene knockout cell line was generated by CRISPR ribonucleoprotein nucleofection. In brief, two sgRNAs targeting the gene (TRR-TCT-1-1_gRNA_1: 5′-GACTCCAACAGGTGGCTCCG-3′ and TRR_TCT-1-1_gRNA_2: 5′- AAAAAGCGTTACGACTCCGC-3′) were mixed at a 1:1 ratio to a final concentration of 50 pmol µl−1. As negative controls, two AAVS1 sgRNAs (AAVS1_sgRNA_142: 5′-TTCTGGGAGAGGGTAGCGCA-3′ and AAVS1_sgRNA_288: 5′-GAGATGGCTCCAGGAAATGG-3′) were used. The sgRNAs were mixed with complete nucleofector solution, buffer SF (Lonza 4D-Nucleofector X kit, V4XP-3032) and sNLS-SpCas9-sNLS nuclease (Aldevron, 9212-0.25MG) according to the manufacturer’s instructions. The 20 µl mixture was incubated for 15 min at room temperature and subsequently added to C4-2B cell pellets (3 × 10⁵ cells per nucleofection) in 1.5 ml Eppendorf tubes. The solutions were transferred to individual wells of a 16-well Nucleocuvette strip and nucleofection was performed using the DS-137 program. Nucleofected cells were retrieved with 150 µl cell culture medium by gentle pipetting and plated in a 6-well plate containing 2 ml medium per well. Cells were monitored every day until each well reached about 85–90% confluency.
At 72 h after nucleofection, around 50% of the cells in each well were collected for analyses of CRISPR editing efficiency. gDNA was extracted from sgAAVS1 and sgTRR-TCT-1-1 cells using a Quick- DNA Microprep Plus kit (Zymo Research, D4074). The genomic regions near the sgRNA cut sites were amplified by PCR and the PCR products were purified using a QIAquick PCR Purification kit (Qiagen, 28106) for Sanger sequencing. The sequencing trace files were analysed in the ICE website (https://ice.synthego.com/#/) to determine CRISPR editing efficiency. The knockout score was 100 at the TRR-TCT1-1 locus in the knockout cell line.
Lentivirus was produced in HEK293T cells grown in 150 mm plates. At 90% confluence, cells were transfected with 0.72 pmol pMD2.G envelop plasmid (Addgene, 12259), 1.3 pmol psPAX2 packaging plasmids (Addgene, 12260) and 1.64 pmol transfer plasmid containing the shRNA targeting tRNA1Arg(UCU), tRNA2Arg(CCG) or tRNA3Arg(UCG), and overexpression plasmids for tRNAArg(UCU) isodecoders, tRNA1Arg(ACG), tRNA2Arg(CCG) and tRNA4Arg(CCU), AGA codon reporter plasmids, SMARCC2 codon switch plasmids or shRNA targeting SMARCC2 using 1.5–2× μg of 1 mg ml−1 PEI (Polysciences, 23966-100) per μg total plasmid DNA. After 24 h, the medium was replaced with fresh medium. Virus-containing supernatant was collected 72 h after transfection and filtered through a 0.45 µm filter then aliquoted for storage at −80 °C.
LNCaP and C4-2B cells transduced with shScr or shUCU were generated by using 1 ml virus with 8 µg ml−1 polybrene to transduce 1.5 × 10⁵ cells in 6-well plates. Following 72–96 h of transduction, selection was done using 1 and 1.5 µg ml−1 puromycin for LNCaP and C4-2B cells, respectively for 5–7 days. Following puromycin selection, 1 and 1.5 µg ml−1 doxycycline, respectively, was added to the medium every 2–3 days to express shRNA in LNCaP and C4-2B cells. tRNA knockdown was confirmed by northern blotting and qPCR. C4-2B cells transduced with shCCG or shUCG were generated using the same protocol.
For tRNA1Arg(UCU) overexpression in LNCaP LP cells and C4-2B LP cells, cells were transduced with 1–2 ml virus and 8 µg ml−1 polybrene and selected using 1 µg ml−1 puromycin for LNCaP LP UCU cells and 1.5 µg ml−1 puromycin for C4-2B LP UCU cells. LNCaP-abl UCU cells were generated by using 4 ml virus with 8 µg ml−1 polybrene to transduce 1 × 10⁶ cells in a 100-mm dish and selected using 1 µg ml−1 puromycin. For overexpression of other tRNAArg(UCU) isodecoders and tRNA1Arg(ACG), tRNA2Arg(CCG) and tRNA4Arg(CCU) in LNCaP LP cells, cells were transduced using the same protocol described above and selected using 1 µg ml−1 puromycin. tRNA overexpression was validated by northern blotting and/or qPCR.
LNCaP AD, LP, UCU cells transduced with AGA codon reporter plasmids and SMARCC2 codon switch plasmids were generated with 2 ml virus and 8 µg ml−1 polybrene and selected using 1 µg ml−1 puromycin. LNCaP UCU cells transduced with shScramble or shSMARCC2 were generated by using 3 ml virus with 8 µg ml−1 polybrene to transduce 80% confluent UCU cells in 6-well plates. Following 72 h of transduction, selection was conducted using 10 µg ml−1 blasticidin for 5–7 days. mRNA and protein knockdown were validated by qPCR and western blotting.
C4-2B cells transduced with shScr or shUCU were generated using lentivirus containing the pFUGW-FerH-ffLuc2-eGFP plasmid (Addgene, 71393) to express luciferase–eGFP. Following 72–96 h of transduction, selection was done using 1.5 µg ml−1 puromycin for 5–7 days and the transduced cells were grown to around 80% confluence in 100 mm dishes and sorted for eYFP-positive and eGFP-positive cell populations. Sorted C4-2B cells transduced with shScr or shUCU were maintained in medium with 1.5 µg ml−1 doxycycline.
Transient transfection
LNCaP and C4-2B cells were seeded at a density of 1 × 10⁵ cells per well in 6-well plates 1 day before transfection. Next, 25 pmol ON-TARGETplus SMARTpool siRNAs purchased from Dharmacon (see Supplementary Table 9 for individual sequences) were mixed with 5 µl Lipofectamine RNAiMAX transfection reagent (Invitrogen, 13778075) in 500 µl Opti-MEM reduced serum medium (Gibco, 31985070) and added to each well. Transfected cells were collected after 7 days for downstream analyses.
Western blotting
Pelleted cells were lysed in Pierce RIPA buffer (Thermo, 89900) supplemented with protease inhibitor cocktail (Roche, 11836153001) and phosphatase inhibitor (Roche, 4906845001). The lysates were centrifuged at 13,000g for 10 min at 4 °C and the protein supernatant was transferred and quantified using the Bradford assay (Bio-Rad, 5000006) or a Pierce BCA protein assay kit (Thermo, A55860). Protein lysates were denatured in 4× Laemmli sample buffer (Bio-Rad, 1610747) with 2-mercaptoethanol at 95 °C for 5 min. Next, 20–50 µg total protein per sample was resolved by SDS–PAGE on 4–20% Mini-PROTEAN gels (Bio-Rad, 4568094) in 1× running buffer (25 mM Tris-base, 192 mM glycine and 0.1% SDS). Separated proteins were transferred to a PVDF membrane (Bio-Rad, 1704273) in 1× transfer buffer with 20% ethanol using a Trans-Blot Turbo Transfer system (Bio-Rad). Membranes were blocked in 5% non-fat dry milk in 1× TBST for 1 h at room temperature with gentle rocking and washed three times in 1× TBST before overnight incubation with primary antibodies diluted in 5% BSA in 1× TBST with 0.05% sodium azide at 4 °C. A list of primary antibodies used is provided in Supplementary Table 9. The membranes were washed three times in 1× TBST and incubated with horseradish peroxidase (HRP)-conjugated secondary antibody (1:5,000–1:10,000 dilution; goat anti-rabbit IgG HRP (Fisher Scientific, PI31460) and goat-anti-mouse IgG HRP (Fisher Scientific, PI31430)) for 1 h at room temperature. After a final wash with 1× TBST, protein bands were visualized by SuperSignal West Pico PLUS chemiluminescent substrate (Thermo, 34580) and imaged on a ChemiDoc system (Bio-Rad). For stripping, membranes were incubated with stripping buffer (100 mM Tris-HCl, 2% (w/v) SDS and 100 mM 2-mercaptoethanol) on a rocker at room temperature for 15 min. The membranes were washed three times in 1× TBST followed by another round of blocking and incubation with primary antibodies.
RNA isolation and purification
Cells were lysed in TRIzol (Fisher Scientific, 15596018) and the lysates were vortexed and incubated at room temperature for 5 min. Next, one-fifth volume of chloroform was added and mixed thoroughly by vortexing followed by centrifugation at 12,000g for 15 min at 4 °C. The aqueous layer was transferred and incubated with isopropanol at −20 °C for 0.5 to 1 h. After centrifugation at maximum speed for 15 min at 4 °C, RNA pellets were washed twice with 75% ice-cold ethanol following resuspension in RNase-free water. For northern blotting, RNA pellets were resuspended in 10 mM sodium acetate pH 4.8 and 1 mM EDTA. The RNA concentration was measured using a Nanodrop instrument. For MSR-seq, RNA was extracted from cells and tumours using a miRNeasy Mini kit (Qiagen, 217004) or a mirVana miRNA Isolation kit (Thermo Fisher, AM1560) per the manufacturer’s protocol.
Northern blotting
RNA samples were denatured in 2× loading dye (8 M urea, 100 mM sodium acetate pH 4.8, 0.05% (w/v) bromophenol blue, 0.05% (w/v) xylene cyanol and 1× TAE) at 70 °C for 10 min and immediately placed on ice. For each sample, 1–3 µg total RNA was separated on acid urea polyacrylamide gels (6% polyacrylamide, 7.5 M urea, 1× TAE and 100 mM sodium acetate pH 4.8) using a Mini-PROTEAN Tetra system (Bio-Rad). RNA was transferred to a positively charged nylon membrane (Cytiva, RPN1210B) in 0.5× TBE buffer for 20–25 min using a Trans-Blot Turbo Transfer system (Bio-Rad) and crosslinked using the optimal crosslink mode (120mJ cm–2) in a Spectrolinker UV Crosslinker & Sanitizing Cabinet. The membranes were prehybridized in ULTRAhyb-Oligo buffer (Invitrogen, AM8663) at 42 °C for 1 h followed by overnight hybridization with 5 pmol 5′-end biotin-labelled probes in hybridization buffer (see Supplementary Table 9 for probe sequences) at 42 °C. The membranes were washed twice in 2× SSC and 0.5% SDS buffer, and further incubated with streptavidin–HRP conjugate (1:5,000 dilution; Genscript, M00091) in hybridization buffer (20 mM sodium phosphate pH 7, 300 mM NaCl and 1% SDS) for 1 h at room temperature. The membranes were washed two or three times in 20 mM sodium phosphate pH 7, 300 mM NaCl, 2 mM EDTA and 0.1% SDS. RNA bands were visualized using Clarity western ECL substrate (Bio-Rad, 1705061) and imaged on a ChemiDoc system (Bio-Rad). For stripping, membranes were incubated with a stripping buffer (0.1× SSC with 0.1% SDS) at 42 °C for 1 h and incubated with 5 pmol 5′-end biotin-labelled probes in hybridization buffer.
RT–qPCR
cDNA was reversed transcribed from 0.5–1 µg RNA using iScript Reverse Transcription supermix (Bio-Rad, 1708841) and subsequently used for iTaq Universal SYBR Green supermix qPCR (Bio-Rad, 1725122). qPCR was performed using a CFX384 Real-Time system (Bio-Rad). RNA expression levels were analysed using the \({2}^{-\Delta \Delta {C}_{{\rm{t}}}}\) method normalizing to housekeeping genes (TBP or PPIA). All primer sequences are provided in Supplementary Table 9. All RT–qPCR experiments were performed in at least three biological replicates and mean ± s.e.m. values are reported.
MSR-seq library preparation
tRNA libraries were prepared using the Multiplex Small RNA Sequencing (MSR-Seq) workflow28. Up to 100 ng total RNA per sample was diluted to 7 μl, followed by oxidation with 1 μl 100 mM sodium periodate and 1 μl 90 mM acetate buffer (pH 4.8). After 30 min at 25 °C, the reaction was quenched with 1 μl 0.6 M ribose. β-Elimination was performed by adding 5 μl sodium tetraborate (pH 8.4) and incubating at 45 °C for 45 min. Next, 5 μl T4 PNK master mix was added to repair the 3′ end, and samples were incubated at 37 °C for 20 min and heat-inactivated. Barcoded 3′ adaptors were ligated in a 50 μl reaction containing 15% PEG8000, 500 μM ATP, 5% DMSO, 1 mM HCC and T4 RNA ligase I, and incubated overnight at 16 °C. Reactions were quenched with 50 µl EDTA stop solution and pooled. Streptavidin-coated beads were added and washed, followed by dephosphorylation using Quick CIP at 37 °C for 30 min. Beads were resuspended and subjected to reverse transcription with SuperScript IV VILO master mix, incubated at 55 °C for 10 min, then 35 °C overnight. After RNase H treatment, a second oxidation and ligation step was performed on-bead using the same reagents and conditions as described above. PCR amplification used Q5 polymerase in a 50 µl reaction with indexed primers. Cycle number 9–15 was determined empirically. Amplified products were cleaned with a DNA Clean & Concentrator-5 (Zymo Research, D4003), and size-selected on a 10% native TBE-PAGE gel (Bio-Rad, 3450053). DNA fragments (around 175–300 bp) were excised, eluted overnight, ethanol-precipitated with GlycoBlue (Thermo Fisher, AM9515) and resuspended in RNase-free water. Library quality was confirmed using an Agilent TapeStation and sequenced on an Illumina NovaSeq at the University of Chicago.
MSR-seq analysis
Barcode demultiplexing and sequence alignment were performed as previously described28. In brief, the libraries were aligned to a custom curated GRCh38/hg38 human transcriptome of nonredundant, high-confidence mature tRNA sequences from the Genomic tRNA Database (GtRNAdb)67,68 plus 22 mitochondrially encoded tRNA sequences (Supplementary Table 10) using bowtie2 (v.2.5.4) and converted to.bam files by SAMtools. Filtered.bam files were processed and merged to sum all the reads of each tRNA gene. Analysis of tRNA expression, fragmentation and modifications were performed with previously developed custom scripts69 (https://github.com/Luke-F1875/MSRseq_data_processing_pipeline). edgeR (v.4.2.0) was run on full-length tRNA transcripts to calculate counts for each isodecoder tRNA. Isoacceptor tRNA counts were made by aggregating anticodon counts for the same isoacceptor group, and edgeR was additionally run on this count dataset. tRNA fragment and modification analysis were performed as previously described28,69, which is part of the routine MSR-seq analysis pipeline. DESeq2 (v.1.48.1) and edgeR packages were used for statistical analysis.
Bulk RNA-seq library preparation and sequencing
RNA-seq library preparation and sequencing were performed by the Genomics Core at the Fred Hutchinson Cancer Center. In brief, RNA-seq libraries were prepared from total RNA using a Watchmaker mRNA Library Prep kit (Watchmaker Genomics, 7BK0001) per the manufacturer’s instructions. Library quantification was performed using a Qubit Flex fluorometer (Invitrogen) and size distribution was validated using an Agilent 4200 TapeStation (Agilent Technologies). The sequencing libraries were pooled in equimolar ratios for paired-end 100 bp sequencing on an Illumina NovaSeq X Plus.
RNA-seq analysis of prostate cancer cell lines
Sequencing reads were mapped to the GRCh38/hg38 human genome using STAR (v.2.7.3a). Gene-level abundance was quantified using the GenomicAlignments summarizeOverlaps function using mode=IntersectionStrict, restricting to primary aligned reads, and counting reads mapping to the exonic regions of genes. FPKM values were calculated using R and used for all downstream analyses.
GSEA analysis
Differential gene expression analysis of RNA-seq data was conducted by using Bioconductor package enrichR (v.3.2) in R using the GO Molecular Function 2023, GO Cellular Component 2023, GO Biological Process 2023, KEGG 2021 and Reactome 2022 pathway databases.
GSVA
The GSVA (v.1.52.3) package in R was used to calculate gene expression signature scores for AR and NE pathways18,20,70. The ARG.6 gene set was defined as AR, KLK3, KLK2, TMPRSS2, PMEPA1 and NKX3-1. The ARG.10 gene set included KLK3, KLK2, TMPRSS2, PMEPA1, NKX3-1, PLPP1, ALDH1A3, FKBP5, STEAP4 and PART1. The NE.6 score was calculated using CHGA, SYP, INSM1, ASCL1, SCG3 and SEZ6 as inputs. The NE.10 gene set was defined as CHGA, SYP, INSM1, CHGB, CHRNB2, ELAVL4, ENO2, PCSK1, SCN3A and NKX2-1. For the ASCL1 pathway score, genes in the NOURUZI NEPC ASCL1 TARGETS set were used71. The EMT pathway genes for GSVA were obtained from GAVISH 3CA MALIGNANT METAPROGRAM 12 EMT 2 (ref. 72). The SOX2 pathway score was analysed by using the top 150 or 300 genes significantly enriched for SOX2 binding in the prostate cancer ChIP–seq dataset (GSM5065468)73. Metastasis pathway genes were obtained from Chandran Metastasis Up, Chandran Metastasis Top50 Up, Chandran Metastasis Dn, Chandran Metastasis Top50 Dn, Tomlins Metastasis Up and Tomlins Metastasis Down from the GSEA Molecular Signatures Database74,75. All the genes in the individual pathways are listed in Supplementary Table 11.
Drug treatment assay
In 96-well plates, 2,500 cells were plated per well and treated with DMSO (vehicle control) or enzalutamide for 72 h. LNCaP AD, LP and UCU cells were treated with 1 or 10 µM enzalutamide, whereas C4-2B AD, LP and UCU cells were treated with 15 or 30 µM enzalutamide. LNCaP-abl WT and UCU cells were treated with 75 µM enzalutamide. LNCaP AD, LP and UCU cells and C4-2B AD, LP and UCU cells were treated with DMSO or the following drugs for 120 h: apalutamide, 5 and 10 µM for LNCaP cells or 30 µM for C4-2B cells; darolutamide, 5 and 10 µM for LNCaP cells or 10 µM for C4-2B cells; or alisertib, 2 µM for LNCaP cells or 10 and 20 µM for C4-2B cells. LNCaP UCU cells transduced with shScr or shSMARCC2 were treated with 10 and 20 µM enzalutamide for 120 h followed by cell viability measurements. Overall, 3–4 technical replicates were included per condition per cell line, and all the treatment assays were completed in at least three biological replicates.
LNCaP and C4-2B cells transduced with Scr or shUCU were plated at a density of 2,500 cells per well, treated with either DMSO or drugs (enzalutamide, LNCaP (1 and 10 µM) and C4-2B (15 and 30 µM); apalutamide, LNCaP (10 µM) and C4-2B (30 µM); darolutamide, LNCaP (5 µM) and C4-2B (30 µM); alisertib, C4-2B (10 and 20 µM)) and incubated at 37 °C in an atmosphere of 5% CO2. Cell growth was measured for 7 days using an Incucyte live-cell imaging and analysis system (Sartorius). The baseline-normalized fold change in cell confluence between day 0 and day 7 was averaged among technical replicates per condition per cell line in each biological replicate.
Mouse prostate organoids were plated in Matrigel (50,000 cells per well) and incubated in organoid medium with DHT containing DMSO or 10 μM enzalutamide for 72 h at 37 °C. Cells were extracted from Matrigel at the time of collection, and cell viability was quantified using a CellTiterGlo luminescent cell viability assay (Promega, G9241) from the four biological replicates.
CellTiterGlo luminescent cell viability assay
Following drug treatment, cell viability was measured using CellTiter-Glo assays according to the manufacturer’s instructions (Promega, G9681 for LNCaP AD, LP and UCU cells, C4-2B AD, LP and UCU cells, LNCaP UCU cells transduced with shScr or shSMARCC2, and mouse prostate organoids; G9241 for LNCaP-abl WT and UCU cells). In brief, 100 µl CellTiter-Glo reagent (Promega) was added to each well and mixed gently for complete cell lysis. Medium-only wells were included for background signal subtraction. Following 30 min of incubation at room temperature, luminescence was measured using a Synergy H1 plate reader (Biotek). Luminescence measurement from technical replicates was averaged and normalized in each biological replicate, and cell viability was calculated by dividing the average luminescence in enzalutamide-treated wells by the average luminescence in DMSO-only wells.
Per cent cell survival in each cell or organoid line is reported as the mean ± s.e.m.
Mouse castration surgery and prostate collection
Castration surgery was performed at 9 months of age for the Hi-Myc model and 5 months of age for the TRAMP model. In brief, a small incision was made in the lower abdomen, each testis was exteriorized with forceps and cut through the fat pad and testicular artery with a cautery pen. The fascia and external skin layer were closed with sutures. Mice were monitored for 72 h after surgery for signs of pain or bleeding. Following castration, mice were aged around 9–10 weeks for the Hi-Myc model and 4 weeks for the TRAMP model. Prostates were collected in 1× DPBS and immediately fixed in 10% neutral-buffered formalin at 4 °C for 48–72 h. Fixed mouse prostates were dehydrated in ethanol, further processed and embedded in paraffin by the Experimental Histopathology Core at the Fred Hutchinson Cancer Center.
H&E staining
Embedded mouse prostates were sectioned at 5 μm on a standard rotary microtome (Leica). H&E staining was conducted by hydration of prostate slices with xylene and a series of ethanol and then stained with haematoxylin (Fisher Scientific, SH26-4D) and eosin (Sigma, E4382). The H&E-stained slides were scanned by the Experimental Histopathology Core at the FHCC and image analysis was done using semi-automated image analysis software HALO (Indica Labs, v.3.6).
Mouse prostate PIN analysis
PIN regions in mouse prostate samples were histologically examined on the basis of key features, including epithelial stratification and crowding, cribriform architecture and protrusion of luminal layers to the lumen. Compared with normal mouse prostate, low-grade PIN is characterized by epithelial tufting and partial lumen crowding76,77. High-grade PIN is a strongly premalignant lesion characterized by dense epithelial piling, nearly filled lumens, complex papillary growth and the presence of cribriform histology. Histopathological evaluation was performed in a blind manner by three independent reviewers for the detection of high-grade PIN in mouse anterior prostates.
Immunohistochemistry
Deparaffinized mouse prostate tissue sections were stained with MYC antibody (1:100 dilution; Abcam, ab32072) using a standard protocol. In brief, the sections were baked at 60 °C for 1 h and rehydrated with CitriSolv and a series of ethanol washes. Antigen unmasking was done at 125 °C for 7 min followed by blocking for 1 h at room temperature in blocking solution (1× TBS + 5% (v/v) goat serum (Fisher, ICN19135680), 1% (w/v) BSA (Sigma, A7906) and 0.1% Triton X-100 (Fisher, BP151)). The slides were washed with 1× TBS and incubated with the primary antibody overnight at 4 °C. The next day, slides were washed three times in 1× TBS and incubated with EnVision+ Single reagent (HRP rabbit) (Dako, K4003) at room temperature for 1 h. Chromogenic detection was done by applying Dako liquid DAB+ substrate (Dako, K3467) for 3 min followed by counterstaining with haematoxylin (Dako, S3309) for 1 min.
The slides were immediately washed with ammonium hydroxide and water, applied with mounting medium (Dako, S3025) and coverslipped for imaging. The slides were scanned using a Ventana DP200 imager and analysed with HALO (Indica Labs, v.3.6) semi-automated image analysis software.
In situ RNA hybridization assay and image analysis
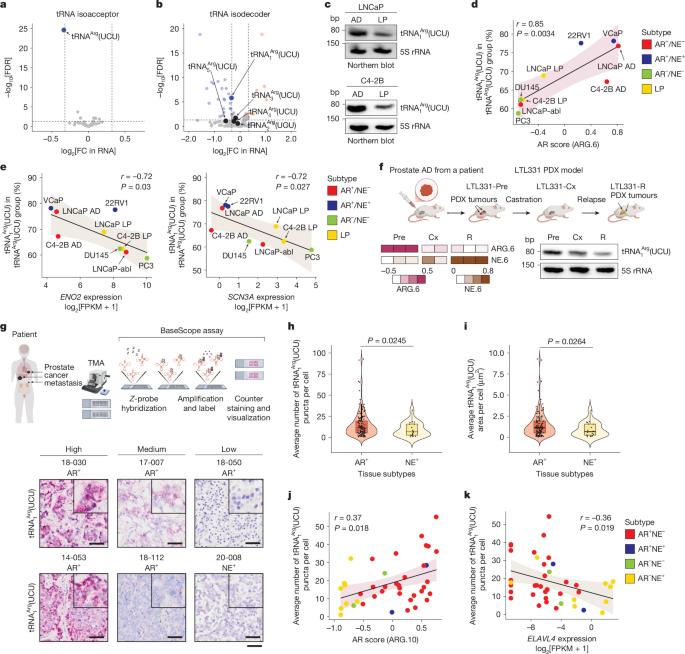
Formalin-fixed paraffin-embedded tissues were baked for 1 h at 60 °C. The slides were loaded onto a Bond Rx Autostainer platform (Leica) to initiate the run. The slides were baked and dewaxed using Leica Bond reagents for dewaxing (Dewax Solution). Antigen retrieval was performed at 95 °C for 15 min using Leica Epitope Retrieval Solution 2 followed byBaseScope protease enzyme for 15 min at 40 °C. After the pretreatment steps, the slides were exposed to hydrogen peroxide for 10 min and then incubated with the custom designed probe against tRNA1Arg(UCU), BA-Hs-tRNA-Arg.TCT-1-1-1zz-st-C1 (ACD, 1811158-C1), the positive-control probe BA-Hs-Ppib-1zz (ACD, 710178) or the negative control-probe BA-DapB-zz (ACD, 701028) at 42 °C for 120 min. After probe incubation, staining continued using a BaseScope LS Reagent kit (ACD, 323600) for the amplification and detection steps, followed by use of a Bond Polymer Refine Red detection kit (Leica, DS9390). Slides were removed from the Bond Autostainer and rinsed in water and allowed to air dry before being dipped in xylene and coverslipped. The slides were cured at room temperature and ×40 images of the slides were acquired on a VS200 imaging system at the Experimental Histopathology Core. Images were analysed using the semi-automated image analysis software HALO (Indica Labs, v.3.6). In the HALO analysis, classifiers were created to distinguish and quantify probe signals from the tumour tissues. The number and area of puncta from probes in tumours were measured and used for statistical analyses.
ENCODE transcription factor ChIP data analysis
Analysis of transcription factor binding near the TRR-TCT1-1 gene locus was conducted by surveying the ENCODE transcription factor ChIP data from GM12878, HepG2 and K562 cell lines. Signals with peak calling were identified using the GRCh38/hg38 UCSC genome browser. Visualization of the ChIP–seq tracks were captured from the website.
Immunofluorescence
LNCaP AD and LP cells were fixed in 10% neutral-buffered formalin for 15 min at room temperature and washed with PBS. Next, 100 µl histogel (LabStorage, HG-4000) heated to 65 °C was used to resuspend the cell pellets. The cell pellets were embedded in three drops of histogel and processed at the Experimental Histopathology Core. In brief, following rehydration, antigen unmasking and blocking, primary antibodies (TARDBP, 1:50 dilution; ZSCAN29, 1:20 dilution) (see Supplementary Table 9 for details) were added to the slides and incubated overnight at 4 °C in a humidity chamber. The next day, the slides were incubated with secondary antibodies (anti-mouse Alexa Fluor 594 (Invitrogen, A11032), 1:500 dilution; anti-rabbit Alexa Fuor 488 (Invitrogen, A11034), 1:500 dilution) (see Supplementary Table 9 for details) for 1 h at room temperature. After 3 washes with 1× TBS, DAPI mounting medium (Vector laboratories, H-2000) was added onto each sample and glass cover slipped for imaging by confocal microscopy.
CUT&RUN
LNCaP AD and LP cell lines were collected and resuspended in 1× PBS with 100 µg ml−1 DNase I for 15 min at 37 °C. The cell pellets were resuspended in 90 µl wash buffer (20 mM HEPES-NaOH pH 7.5, 150 mM NaCl and 0.5 mM spermidine with EDTA-free protease inhibitor cocktail) and bound to 10 µl concanavalin A-conjugated beads (EpiCypher, 21-1401) prewashed in binding buffer (20 mM HEPES-KOH pH 7.9, 10 mM KCl, 1 mM CaCl2 and 1 mM MnCl2). Following 10 min of incubation at room temperature, the tubes were placed on a magnetic stand and the supernatants were removed. The ConA-bead-permeabilized cell mixture was resuspended in 100 µl antibody solution (wash buffer with 2 mM EDTA). Antibodies (anti-rabbit IgG, H3K4me3, POLR3A, TARDBP and ZSCAN29; see Supplementary Table 9 for details) were added and mixed gently. The samples were incubated with antibodies overnight at 4 °C with mixing and submitted to the Genomics Core High Throughput Screening Laboratory at the Fred Hutchinson Cancer Center for autoCUT&RUN processing. At the Core, libraries were prepared using a Beckman Biomek i7 liquid-handling instrument equipped with a 96S Super Magnet Plate (Alpaqua, SKU A001322) for MNase chromatin digestion and magnetic separation of samples during wash steps. End-repair, adapter ligation and PCR amplification reactions were performed on a separate thermocycler, and purified PCR products were analysed on an Agilent 4200 TapeStation (Agilent Technologies). The libraries were pooled for paired-end 50 bp sequencing on an Illumina NovaSeq X Plus.
CUT&RUN sequencing and data analysis
Sequencing reads were aligned to the human reference genome (hg38) using bowtie2, and only uniquely mapped reads were retained for downstream analyses. Peak calling was performed using SEACR (Sparse Enrichment Analysis for CUT&RUN; v.1.3) with matched IgG controls using the relaxed threshold setting. CUT&RUN reads were quantified over annotated tRNA loci extended by 50 bp upstream and downstream using summarizeOverlaps from the Bioconductor GenomicAlignments package (v.1.40.0). Only primary, properly paired alignments with a mapping quality (MAPQ) ≥ 30 were included in the analysis. Raw fragment counts were imported into the edgeR package (v.4.2.0), in which library sizes were normalized using the trimmed mean of M-values method. Differential occupancy between conditions was assessed using the quasi-likelihood negative binomial generalized linear model framework implemented in edgeR, and P values were adjusted for multiple testing using the Benjamini–Hochberg FDR procedure.
ChIP–qPCR
ChIP–qPCR was performed according to the manufacturer’s instructions (Thermo, 26157). LNCaP and C4-2B cells transfected with non-targeting, TARDBP or ZSCAN29 siRNAs were crosslinked with 1% paraformaldehyde for 10 min at room temperature then neutralized with 1× glycine solution for 5 min. After removal of formaldehyde–glycine-containing solution, cells were collected in 1× PBS containing protease inhibitor cocktail and spun down at 3,000g for 5 min at 4 °C. The cell pellets were resuspended in 200 µl membrane extraction buffer and incubated on ice for 10 min. Following centrifugation at 9,000g for 3 min, the pellets of nuclei were resuspended in MNase digestion buffer with MNase. The nuclei–MNase mixture was incubated at 37 °C for 15 min. The MNase reaction was stopped by incubating with MNase stop solution on ice for 5 min. The nuclei were pelleted by centrifugation at 9,000g for 5 min at 4 °C and resuspended in 100 µl 1× IP dilution buffer. Sonication was conducted using Q800R3 sonicator (Qsonica) for 10 min at 4 °C with the following setting: 20% amplitude, 20 s on and 10 s off. Supernatants after centrifugation at 9,000g for 5 min were transferred to 1.5 ml Eppendorf tubes containing primary antibodies (anti-rabbit IgG, POLR3A, TARDBP and ZSCAN29; see Supplementary Table 9 for details). The immunoprecipitation reactions were incubated overnight at 4 °C with mixing. The next day, the immunoprecipitation reactions were incubated with protein A/G magnetic beads for 2 h at 4 °C on a rotator. The tubes with immunoprecipitation reactions were placed on a magnetic stand and the supernatants were carefully removed by pipetting. Washing with IP wash buffer 1 was conducted three times and IP wash buffer 2 with 350 mM NaCl twice. 1× elution buffer was added after the last wash and the tubes were incubated at 65 °C for 30 min followed by proteinase K digestion. DNA was recovered using a MinElute Reaction Cleanup kit (Qiagen, 28006) and used for qPCR with the primers listed in Supplementary Table 9. The qPCR results from each immunoprecipitation sample were normalized to input (ΔCt) and further normalized to IgG control (ΔΔCt). The fold enrichment of POLR3A, TARDBP and ZSCAN29 at different TRR-TCT isodecoder gene loci was normalized to TRR-TCT1-1 in each biological replicate for statistical analysis.
Confocal imaging and analysis
Imaging was conducted in the FHCC Cellular Imaging Core using a Dragonfly 200 (Andor Technologies) spinning disk confocal microscope on a Leica DMi8 microscope stand equipped with a ×63/1.4 PL APO CS2 objective. DAPI, Alexa488 and Alexa594 were excited with 405 nm, 488 nm and 561 nm lasers, respectively, and detected on a Zyla 4.2 sCMOS camera with detection windows 445/46, 525/30 and 594/43, respectively. Z stacks were acquired for each condition. Each image was analysed using Imaris (Oxford Instruments, v.10.2).
Immunofluorescence image analysis
The immunofluorescence-stained slides were visualized using the DAPI signal to identify cell nuclei and GFP and RFP signals to quantify nuclear ZSCAN29 and TARDBP expression, respectively. Foci per cell were segmented using Imaris Cell, and we report the mean foci intensity per cell nuclei. The differences in mean intensity of GFP and RFP signals between LNCaP AD and LP cell lines were used for statistical analysis.
Codon reporter assay analysis
For the analysis of confocal images from LNCaP AD, LP and UCU cells expressing the 12×, 6×, 4× and 2× reporter constructs, the EBFP2 signal was used to identify cells, and the mCherry signal to identify foci. Foci per cell were segmented using Imaris Cell, reporting maximum foci intensity of mCherry per cell and further normalized by the mean intensity of EBFP2. The ratios of mCherry-to-EBFP2 intensity among LNCaP AD, LP and UCU cell lines were used for statistical analysis.
Polysome profiling
Polysome profiling was conducted as previously described78,79. Before lysis, LNCaP AD, LP and UCU cells were collected and centrifuged at 500g for 5 min. The cell pellets were resuspended in 1 ml PBS with 100 µg ml−1 cycloheximide in ethanol and placed on ice for 10 min. Cell pellets were collected following centrifugation, flash-frozen in liquid nitrogen and lysed in polysome lysis buffer (10 mM Tris pH 8, 140 mM NaCl, 1.5 mM MgCl2, 0.25% NP-40, 0.1% Triton X-100, 640 units of SUPERase-In RNase inhibitor (Thermo, AM2694), 150 µg ml−1 cycloheximide and 20 mM DTT). Lysed cells were incubated on ice for 45 min with vortexing every 10 min and centrifuged at 9,300g for 5 min at 4 °C. Cleared lysates were measured by a Bradford assay and 1.5 mg of protein was loaded onto each polysome gradient generated by mixing 10–50% sucrose gradients using a Biocomp gradient station. The gradients were centrifuged at 37,000 rpm using a SW41 rotor for 2.5 h at 4 °C and fractionated on a Biocomp fractionator into 14 fractions. On the basis of A280 UV peaks measured using an EM-1 UV monitor (Bio-Rad), fractions were pooled into highly translated (five or more ribosomes), lowly translated (two to four ribosomes) and monosome (one ribosome) groups following RNA extraction.
Polysome RNA-seq library construction
RNA was extracted from LNCaP AD, LP and UCU polysome fractions using a Direct-zol RNA Miniprep kit (Zymo Research, R2053). RNA samples combined into 80S monosome, low polysome, high polysome samples and total RNA were used for RNA-seq library construction with a TruSeq Stranded mRNA library prep kit (Illumina, 20020595). In brief, 300 ng RNA was combined with ERCC Spike in controls (1:1,000 dilution; Invitrogen, 4456740) and proceeded with polyA+ RNA isolation, cDNA synthesis, end repair, A-base addition and ligation of the Illumina indexed adapters according to the manufacturer’s instructions. Libraries were selected for 250–300 bp fragments using AMPure XP beads (Beckman Coulter, A63881) and PCR amplified. After PCR cleanup with AMPure XP beads, the libraries were quantified using a Qubit dsDNA HS assay (Thermo Fisher, Q32851), and the fragment size was analysed using an Agilent TapeStation. The libraries were pooled for paired-end 100 bp sequencing on an Illumina NovaSeq 6000.
Polysome RNA-seq analysis
Raw sequencing reads were assessed for quality using FastQC (v.0.12.1). Libraries that passed quality control were trimmed of sequencing adaptors then aligned to the GRCh38 human genome using STAR2 (v.2.7.3a) and quantified for gene-level expression using HTSeq (v.0.11.1) against the GENCODE v.39 gene annotation database to calculate strand-specific read counts for each gene. Differential gene expression analysis was performed using DESeq2 (v.1.48.1) to find genes that were transcriptionally regulated using a log2(FC) of 25% and an adjusted P value of 0.05. Xtail (v.1.2.0) was used to analyse genome-wide TE by calculating the ratio of polysome-to-monosome for each transcript. Cut-off values were made using a log2(FC) of 15% and an adjusted FDR of 0.05 to find transcripts with significant changes at the translational level.
Codon usage analysis
For each cell type (AD, LP and UCU), genes with the highest and lowest TE were selected from Xtail analysis (v.1.2.0). Codon frequencies for each gene were calculated from MANE Select transcripts (v.1.4) using GENCODE v.46 protein-coding transcript sequences as the fraction of each sense codon relative to total sense codons in the coding sequence. To control for amino acid composition differences between gene sets, codon frequencies were normalized in each amino acid family by dividing each codon’s frequency by the sum of frequencies of all synonymous codons for the same amino acid, which generated relative codon usage frequencies. Methionine (AUG) and tryptophan (UGG), each encoded by a single codon, were excluded as uninformative. For each of the 59 remaining sense codons in each cell type, we computed the observed difference in mean relative codon frequency between the high-TE and low-TE gene sets. To generate a null distribution, we pooled the genes and randomly permuted the high and low TE labels 10,000 times, recomputing the mean relative frequency difference for each permutation. Two-sided empirical P values were calculated as (m + 1)/(N + 1), where m is the number of permutations with an absolute difference greater than or equal to the observed absolute difference and N is the total number of permutations. P values were corrected for multiple testing using the Benjamini–Hochberg method across 59 codons in each cell type.
In vivo metastasis assay
In brief, 2 × 10⁵ C4-2B cells transduced with shScr or shUCU and eGFP-luciferase expression were resuspended in 100 µl PBS and xenografted into 8–12-week-old male NSG mice via intracardiac injection (n = 10 mice per group) using the ultrasound in the FHCC preclinical Imaging Core. Following injection, mice were given water containing doxycycline (1 g l–1) for stable expression of shRNAs during the assay. Metastasis of injected cells was monitored in vivo by bioluminescence imaging. In brief, mice were given 150 mg kg−1 VivoGlo Luciferin (Promega, P1042) by intraperitoneal injection and anaesthetized in an isofluorane induction chamber for 5–10 min. The mice were placed in Lago X under continued isoflurane anaesthesia, and bioluminescence signals from metastatic cells were captured using Easy Mode. The monitoring was conducted at least once a week until day 64. The bioluminescence signals from each measurement were quantified using AuraAnalysis software (v.5.0.0) and analysed between groups (shScr and shUCU) and within groups.
Visualization
All plots were made using GraphPad Prism (v.10.6.1) or R (v.4.6.0) with base R or ggplot2 and the final figures were assembled using Adobe Illustrator.
Statistical analysis
Statistical tests were performed using GraphPad Prism 10 (v.10.6.1) or R (v.4.6.0). No randomization or blinding was conducted in this study. All analyses were based on objective quantification of the data generated from in vitro and in vivo experiments. Specific statistical analyses and the number of replicates for each experiment are described in detail in the figure legends and relevant sections in the Methods. All data are presented as the mean ± s.e.m. unless specified otherwise. All statistical analyses were two-sided and unpaired unless specified otherwise. For comparison of three or more groups, ANOVA with multiple-comparisons tests was used. Statistical tests used are listed in the figure legends. P values are shown in the respective figures. P values from Extended Data Figs. 1f,g and 2g are included in Supplementary Table 12.
Reporting summary
Further information on research design is available in the Nature Portfolio Reporting Summary linked to this article.